Table of Contents

1. STL
1.1. Introduction
In 1999, RFC 2544 proposed a well accepted Benchmarking Methodology for Network Interconnect Devices. Packet and bandwidth throughput are mostly measured in accordance with the aforementioned Request for Comments. It is critically important in terms of benchmarking for a DUT to discover its Non Drop Rate (NDR). The NDR’s purpose is to identify the maximal point in terms of packet and bandwidth throughput at which the Packet Loss Ratio (PLR) stands at 0%. Hence, identifying the NDR provides us with the optimal packet and bandwidth throughput. However, sometimes a small amount of drops might be allowed. As such, we define Percent Drop Rate (PDR). PDR=1 means that 1% drop rate is allowed.
1.2. Algorithms to find the NDR
The first approach to an algorithm that calculates the NDR would be binary search. This is indeed our first algorithm, and the default mode we implemented. Start transmitting at the maximal rate and perform binary search based on the binary decision of having or not having drops. To stop, we offer some parameter to the user which decides the distance in percent between two valid runs. If the distance is lower than the user provided parameter then the algorithm stops.
However, one can optimize the algorithm’s running time by some constant factor. The binary search halves the interval based on a simple binary decision, were there drops? Fortunately, we have more information than this simple binary flag, we know the percentage of drops. As such, we can use this information to make smarter decisions and to converge faster to the NDR. TRex offers NDR benchmarking in two modes. The default mode is the well known binary mode and the second mode is an optimized version of binary search which we will discuss in length through out the documentation.
1.3. How to run
Navigate to the scripts folder.
-
Run the TRex Server with the flags you would like. For more information on flags use --help.
[bash]>sudo ./t-rex-64 -i -c 1-
Run the ndr bash script. This script will figure out the right version of python (or a version you decide) and run the benchmark tool. Here as well, one can get information on the flags using --help.
[bash]>./ndr --stl --python3 --port 0 1 --max-iterations 5 -t 10 --verbose --force-map --bi-dir --pdr 0.01 --title 'Documentation'
Don’t let the many flags scare you. We will explain them in depth. The results look something like this.


1.4. Tutorials
1.4.1. Max Iterations and iteration duration
Probably two of the most important parameters in terms of the algorithm are the number of iterations allowed and the duration of each iteration. The iteration duration mustn’t be short, since it takes time to transmit at max rate and it takes time for the counters to normalize. The default value is 20 seconds. Max iterations is an upper bound for binary search if it takes too many iterations (logarithmic complexity). The benchmark stops if it finds the NDR, or after max iterations, the early of the two. When it reaches the number of max iterations the algorithm stops and results might not be fully accurate. However, sometimes we are bound by some time frame and we want to get the best results in that time frame, and that is why the max iterations flag is offered. For example, to run the benchmark with 3 iterations at max, each iteration with a duration of 10 seconds and the first iteration being 20 seconds we can write:
[bash]>./ndr --stl --port 0 1 -v -x 3 -t 10 -ft 20
We suggest you to be careful with the duration of the iteration. The disadvantage of long durations is quite clear, however short durations might be dangerous. It takes T-Rex a few seconds to normalize after transmitting at a high rate and it also takes a few seconds to start transmitting at a high rate. Hence, try to avoid very short duration or you might suffer from strange results.
1.4.2. Drop rate percentage, allowed error, queuing and latency tolerance
Until now we didn’t get in the details of how the algorithm stops. If we don’t define some criterion of precision, we can, theoretically speaking, run forever. Hence, the following flags:
-
pdr error represents the allowed error around the best valid result seen so far (current optimum), in percent. Following the aforementioned, it is not recommended to use a 0% pdr error, since it will cause precision problems. The default value is 1%.
-
pdr (percentage of drop rate) represents the allowed percentage of drops, out of total traffic. The default value is 0.1%.
-
q-full represents the percent of traffic allowed to be queued when transmitting above the DUT’s capability. Same as the previous values, it isn’t recommended using 0%. The default value is 2%.
-
max-latency The maximal latency allowed in msec. Default value is 0, it signifies that the max latency is unset.
-
lat-tolerance Percentage of packets allowed with latency beyond max-latency. Default is 0%. In this case the max latency will be compared head on with the highest latency packet in the run.
A run is considered valid if in that run, the percentage of queue full is lower or equal to q-full and the percentage of drop rate is lower or equal than the pdr and the percentage of latency packets beyond max-latency is below lat-tolerance.
To find NDR (pdr = 0%) with 3% allowed error and 5.5% queueing capability:
[bash]>./ndr --stl --port 0 1 -v --pdr 0 --pdr-error 3 --q-full 5.5
To find NDR with pdr = 2% and a maximal latency of 30 msec with tolerance of 5%:
[bash]>./ndr --stl --port 0 1 -v --profile stl/udp_1pkt_src_ip_split_latency.py --max-latency 30 --lat-tolerance 5
1.4.3. Traffic engineering
The type of traffic on which we run the benchmark is also important for the results of the benchmark. Some would debate that IMIX would be the ultimate type of traffic to benchmark on. TRex offers to simulate every kind of stateless traffic to run the benchmark. Just write a stateless profile (or use an existing one) and load it into the benchmarker. This offers great flexibility combined with all of possibilities the Field Engine supplies. To read more about profiles, please consult the STL documentation. The default profile is IMIX. To control the profiles use the following flags:
-
--profile - The path to the location of the profile.
-
--prof-tun - List of tunables to pass along to the profile just as in a normal profile in STL.
For example, to generate IMIX traffic and pass a few tunables one can write:
[bash]>./ndr --stl --port 0 1 -v --prof-tun a=1,b=3
To generate IMIX for IPv6 run:
[bash]>./ndr --stl --port 0 1 -v --profile stl/imix_ipv6.py
To generate latency traffic (you can write your own profile if this isn’t enough):
[bash]>./ndr --stl --port 0 1 -v --profile stl/flow_stats_latency.py
Another important profile to keep in mind is the bench profile, build exactly for the purpose of benchmarking.
[bash]>./ndr --stl --port 0 1 -v --profile stl/bench.py
And lastly, if we want to test with a benchmarking profile build for UDP we can use:
[bash]>./ndr --stl --port 0 1 -v --profile stl/udp_for_benchmarks.py
1.5. Running example
Let us show a running example: We will run the server with 7 cores per interface (a couple of ports) and one interface.
[bash]>sudo ./t-rex-64 -i -c 7
Let’s run the benchmarking on IMIX traffic (default), uni-directional.
[bash]>./ndr --stl --port 0 1 --verbose
The first iteration we try to find the maximal running rate.
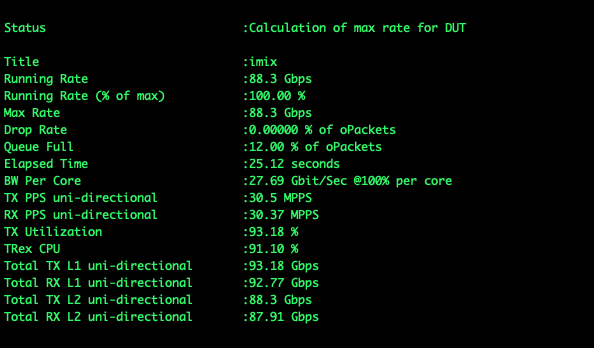
We see that in this case the device handles well with the drops, it has a relatively a low drop rate. However, a high percentage of packets were queued and therefore the tool will try to find a transmitting rate where the queuing percentage is below the allowed value.

The first iteration (finding max rate is not considered an iteration) is ran at 50% (simple binary search).

After 7 iterations, we conclude that P-Drop Rate (PDR is 0.1% in our case and queue full is 2%) is 86.98 Gbps.
1.6. Optimized binary search
As we mentioned earlier, we have more information than a simple binary query. We know the exact percentage of drop or the percentage of queue full. So maybe, in the last example, it would be better to start searching for the NDR around 83-84% of the maximal rate (we had 16.64% queue full). The idea of the optimized binary search is simple. Suppose we have p% drop or queue full.
Define assumed ndr as (100-p)% of max rate.
Define the expected ndr interval as [(100-q)% of assumed ndr, (100+q)% of assumed ndr] for some parameter q that the user can configure.
-
Transmit at the upper bound of the expected ndr interval, if it is not too close to the max rate else skip to 3a.
-
If there were drops or queue full:
-
Perform binary search at the following interval: [(100+q)% of assumed ndr, max rate]
-
-
Else:
-
Transmit at the lower bound of the expected ndr interval:
-
If there were drops or queue full:
-
Perform binary search at the expected ndr interval.
-
-
Else:
-
Perform binary search at [0, (100-q)% of assumed ndr]
-
-
In our tests, the optimized algorithm improves the runtime of the benchmark by some iterations as in almost every possible case we will perform binary search in 2a or 3bi. This intervals are quite small if we keep a small q value and it will take us less time to get there than with the normal binary search.
1.6.1. How to use
Let us run the example the previous example (IMIX) now with optimized binary search. We will run the server with 7 cores per interface as before.
[bash]>sudo ./t-rex-64 -i -c 7
Same example as before, with optimized binary flag and q = 10% (--opt-bin-search-percent). The default value of q is 5%.
[bash]>./ndr --stl --port 0 1 --verbose --opt-bin-search --opt-bin-search-percent 10
The first iteration we try to find the maximal running rate, the same as the normal version, with the same results.
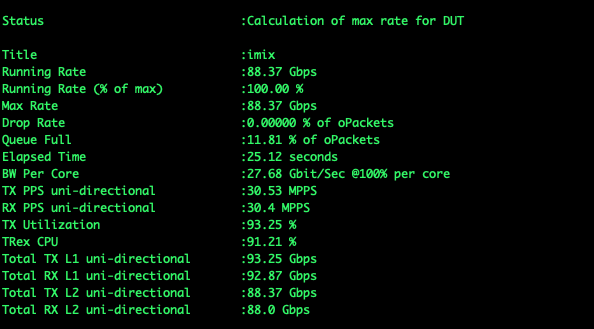
The DUT’s queue is full, hence the benchmarker will try to find a point where the DUT’s queue is below the allowed rate with the optimized binary search.

The algorithm tries the upper bound of the expected ndr interval and the upper bound is below the ndr, hence it will try to search above the upper bound of the expected interval.
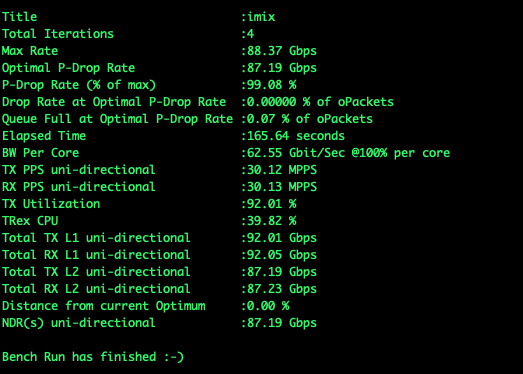
After 4 iterations, we conclude that P-Drop Rate (PDR is 0.1% in our case and queue full is 2%) is 87.66 Gbps.
- Discussion
-
-
The simple binary search took 7 iterations. The optimized binary search took 7 iterations (including checking the upper bound). Hence in this case, (as in most cases) the optimized binary search is faster.
-
We see that the NDR in the two cases are slightly different, being 87.66 Gbit in the binary search and 87.7 Gbit in the optimized binary search. However this nothing to worry about, since as we mentioned we calculate the non drop rate up to a user defined error percentage which can be controlled with --pdr-error. It is important to mention that the lower value could be achieved by any of the algorithms.
-
1.7. API to the NDR Benchmarker, Plugin file
- Goal
-
Introduce the API to the benchmarker, discuss its use cases and how to use. Show simple running tutorial.
The benchmarker is meant to test different DUTs. Each DUT has its own capabilities, specifications and API. We clearly can’t support all the DUTs in the world. Hence, we offer the user an API which can help him integrate his DUT with the TRex NDR Benchmarker. The user can control his device before each iteration (pre) and optimize his DUT for maximum performance. He also can get different data from the DUT after (post) the iteration, and decide whether to continue to the next iteration or stop.
1.8. How to use the API
In order to use the API, you need to provide a Python file just like the one supplied below. For more information on each parameter, please read the documentation in the following file.
- File
import stl_path class MyNDRPlugin(): def __init__(self): # Can initialize the DUT before the benchmarking begins. pass def pre_iteration(self, finding_max_rate, run_results=None, **kwargs):# Pre iteration function. This function will run before TRex transmits to the DUT. # Could use this to better prepare the DUT, for example define shapers, polices, increase # buffers and queues. # You can receive tunables in the command line, through the kwargs argument. pass def post_iteration(self, finding_max_rate, run_results, **kwargs):
# Post iteration function. This function will run after TRex transmits to the DUT. # Could use this to decide if to continue the benchmark after querying the DUT post run. # The DUT might be overheated or any other thing that might make you want to stop the run. # You can receive tunables in the command line, through the kwargs argument. should_stop = False return should_stop # dynamic load of python module def register():
return MyNDRPlugin()
| Runs before we send traffic to the DUT. |
| Runs after finishing sending traffic to the DUT. |
| Internal use to load the profile dynamically. Need to provide. |

|
The function names must be the same as in the code supplied. The class name could be anything. |
1.9. TRex offered parameters and tunables
Our plugin will be simple, it will check the CPU utilization of TRex after every run and if exceeds some allowed percentage, it will stop the run. This isn’t a very intelligent use of the API because of the following reasons (but it shows how to use the API):
-
The first iteration of the algorithm tries to find the max rate, hence it will exhaust the CPU and most likely stop the benchmark.
-
The API is meant to be used together with the DUT and make the decision whether to stop based on the DUT, not on TRex.
import stl_path


class CPUAllowedPercentageNDRPlugin():
    def __init__(self):
        pass

    def pre_iteration(self, finding_max_rate, run_results=None, **kwargs):
        pass

    def post_iteration(self, finding_max_rate, run_results, **kwargs):
        cpu_percentage = run_results['cpu_util']
        allowed_percentage = kwargs['allowed_percentage']
        should_stop = True if cpu_percentage > allowed_percentage else False
        return should_stop


# dynamic load of python module
def register():
    return CPUAllowedPercentageNDRPlugin()
After starting the server, we run the benchmarking in the following way.
[bash]>./ndr --stl --port 0 1 --bi-dir -v --plugin-file automation/trex_control_plane/interactive/trex/examples/stl/allowed_percentage_ndr_plugin.py --tunables allowed_percentage=95
- Output
-
The following picture provides the results:

As mentioned, the run to find the max rate exhausts the CPU (99.49% utilization) and therefore, the plugin decides to stop the run.
1.10. Device under test with optimized binary search
A more useful application of the API would be the following:
Implement a class for a device under test. Connect to the device either by console or ssh, and send to it commands before the iteration. Such a case would be QoS, which might offer bigger buffers, define shapers or polices to lower the drops. Also the decision whether to stop can be a function of the results in the device under test, maybe CPU usage.
We implemented a simple version (without connecting to a real device), just for an example:
- File
import stl_path

class DUT():
    def __init__(self, name):
        self.counter = 0
        self.name = name

    def QoS(self, rate_tx_bps, rate_rx_bps):
        pass

    def prepare(self, rate_tx_bps, rate_rx_bps):
        self.QoS(rate_tx_bps, rate_rx_bps)

    def should_stop(self, drop_percentage, queue_full_percentage):
        self.counter += 1
        if self.counter > 2 and drop_percentage < 3 and queue_full_percentage < 1:
            return True
        return False

class DeviceUnderTestNDRPlugin():
    def __init__(self):
        self.dut = DUT(name="Cisco Catalyst 3850x")

    def pre_iteration(self, finding_max_rate, run_results=None, **kwargs):
        if run_results is not None:
            self.dut.prepare(run_results['rate_tx_bps'], run_results['rate_rx_bps'])

    def post_iteration(self, finding_max_rate, run_results, **kwargs):
        return self.dut.should_stop(run_results['drop_rate_percentage'],
                                    run_results['queue_full_percentage'])


# dynamic load of python module
def register():
    return DeviceUnderTestNDRPlugin()
After starting the server, we run the benchmarking in the following way.
[bash]>./ndr --stl --port 0 1 -v -f automation/trex_control_plane/interactive/trex/examples/stl/dut_ndr_plugin.py --opt-bin-search
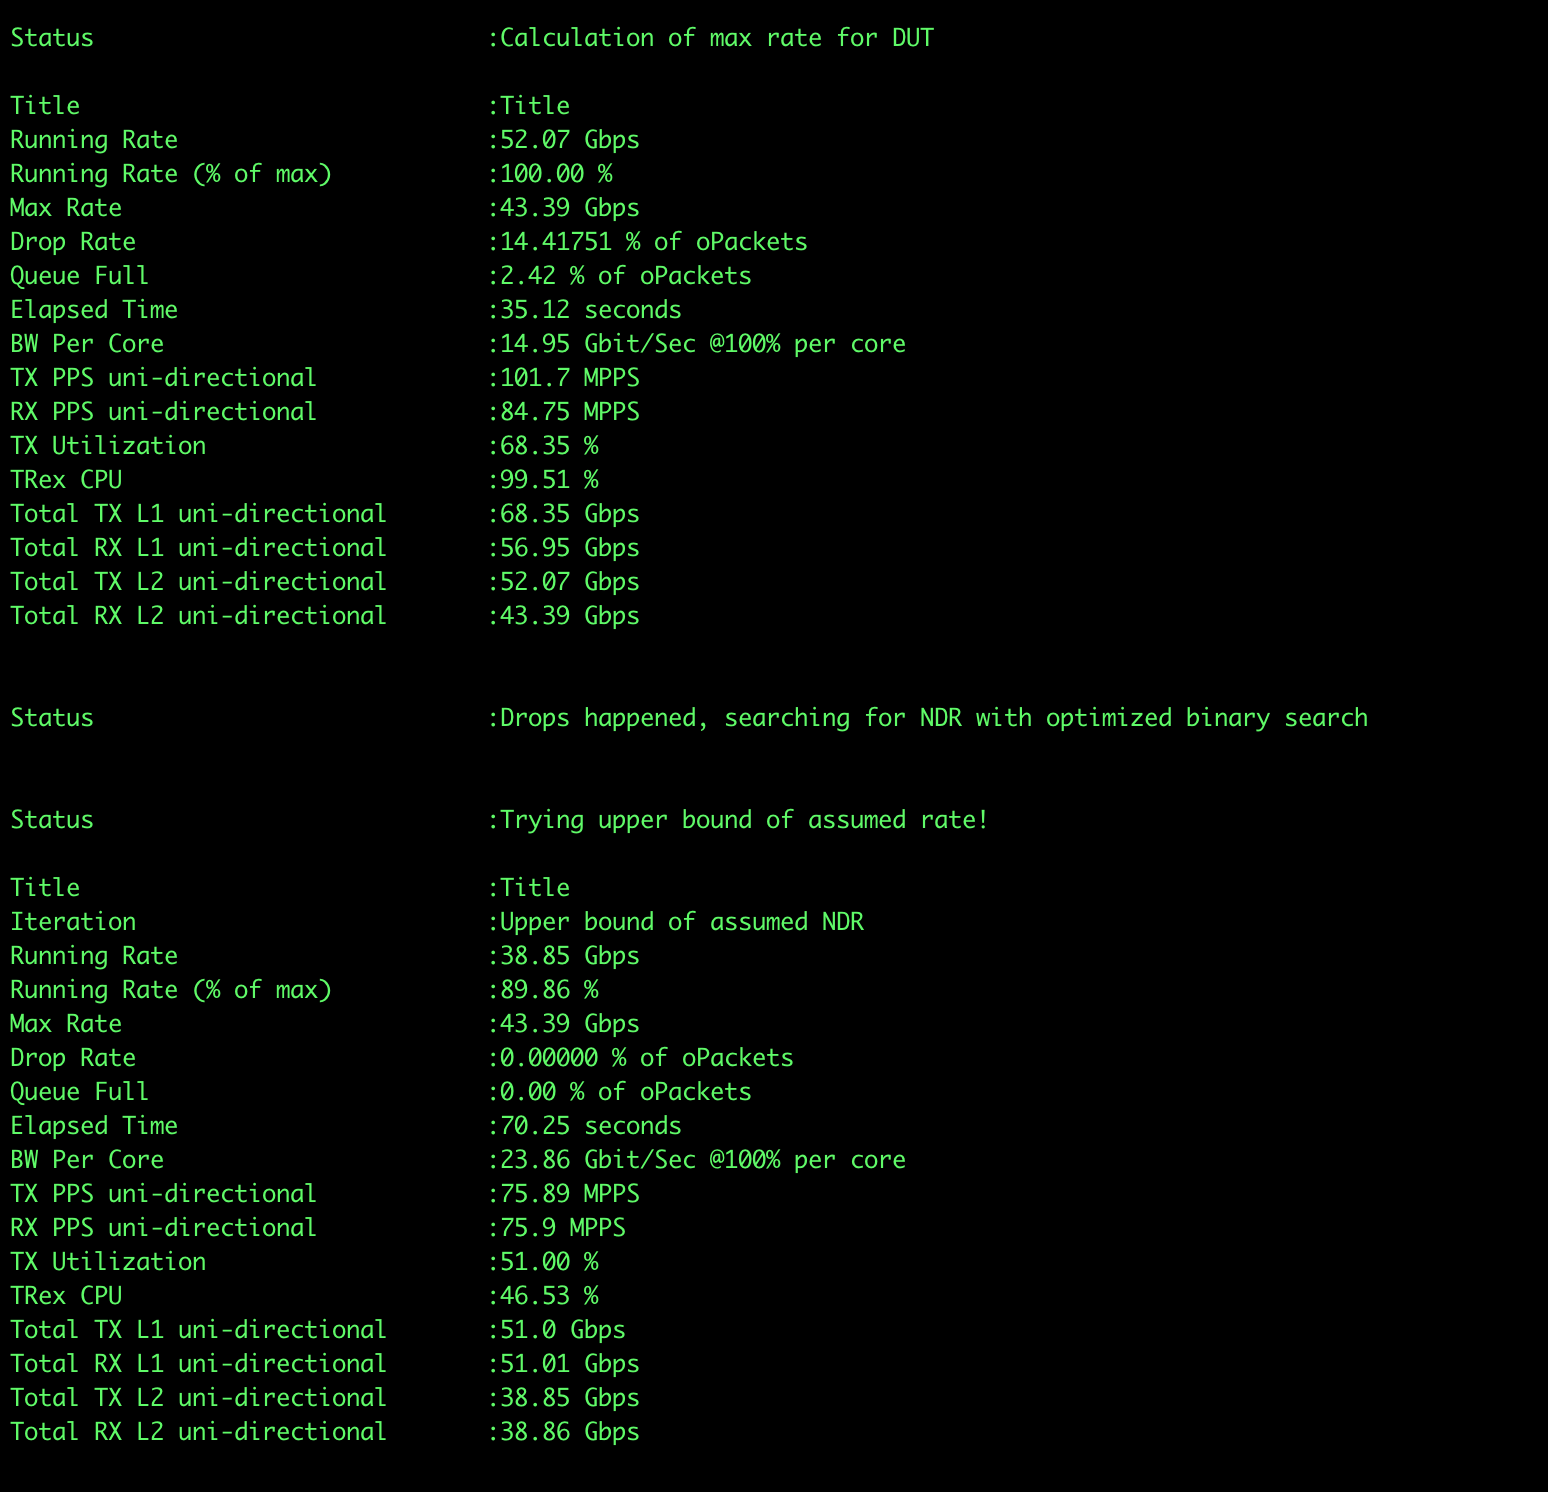

We can see that the plugin stopped after 3 iterations (finding max rate, upper bound and iteration 0) and the rates were as allowed.
2. ASTF
2.1. Introduction
We implemented some version of NDR for ASTF mode. However, the script differs as these modes differ. Although many of the functionality of STL will work here, many of it won’t. As such, we strongly suggest to read carefully each of the modes and understand the use cases. The use case in which this script is meant to work in ASTF mode is simple. We assume a single TRex machine, where even number ports are clients and odd number ports are servers. For example if we have a TRex setup with 4 ports, ports 0, 2 will act as clients while ports 1,3 will act as servers.
2.2. Main differences from STL
The main difference compared to STL lies in the fact that there is no such thing as drops or drop percentage. You might rightfully question yourself, what is NDR (Non Drop Rate) if there are no drops? ASTF has its own implementation of errors and error validation. The script uses this implementation instead of drops. Hence, the purpose of NDR in ASTF is to compute the maximal transmission rate, or in terms of ASTF, the maximal CPS multiplier such that there are no errors.
No drop percentage however means there is no optimized binary search. In ASTF we are back to a simple binary decision, are there errors or not and as such we are limited to a simple binary search.
The other main difference is the inability to run at 100%. As such, when running the script for ASTF, the user must provide two crucial values, --high-mult and --low-mult. Each of theses values is an integer representing a multiplier of CPS. The binary search is performed in the domain of multipliers provided. Hence, if you provide a large domain the results might be less accurate. In spite of this, providing a small domain that doesn’t contain the NDR multiplier might provide false results.
2.3. How to run
Same as in STL, navigate to the scripts folder.
-
Run the TRex Server in ASTF with the flags you would like. For more information on flags use --help.
[bash]>sudo ./t-rex-64 --astf -i -c 7
-
Run the ndr bash script. This script will figure out the right version of python (or a version you decide) and run the benchmark tool. Pay attention that you need to specify --astf when running the script.
[bash]>./ndr --astf -v -x 5 -e 1 -q 2 -lpps 80 --max-latency 50 --lat-tolerance 10 -o hu -f automation/trex_control_plane/interactive/trex/examples/astf/astf_error_logging_plugin.py --profile astf/udp_mix.py --high-mult 80 --low-mult 20
You can get detailed information of all the flags using -h.
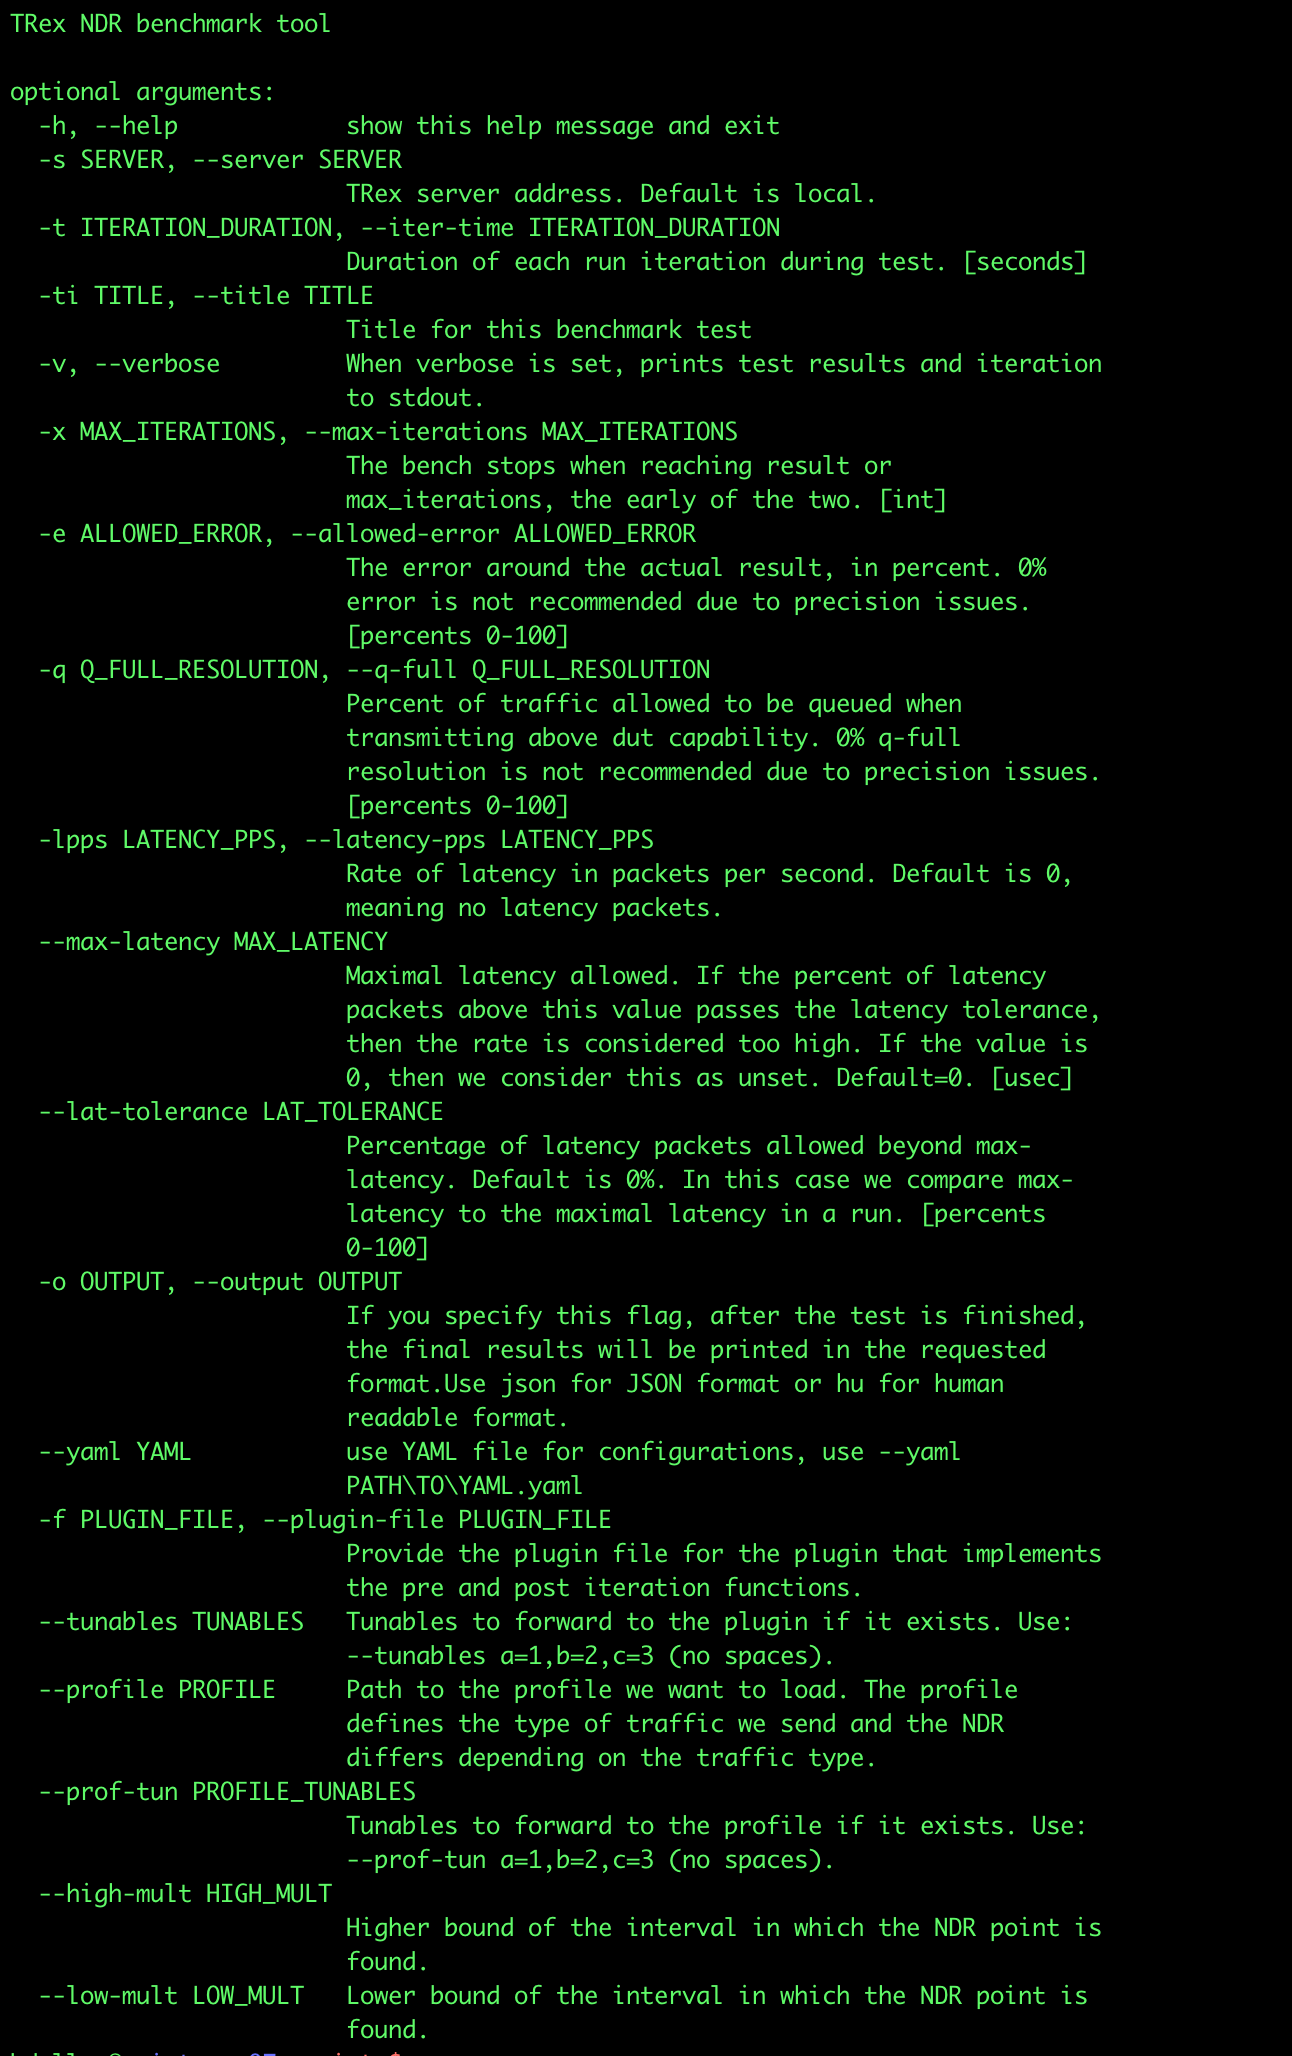
After the script finishes, it will print the final results in the following way:

And because we ran the script with --o hu it will print the following dictionary in the end.

2.4. Tutorials
2.4.1. Errors, queuing and latency
We mentioned before that in ASTF there are no drops, and the drops are replaced by errors. Errors however, don’t have a percentage and once an error happens, it disqualifies that transmission (run) from being valid. You can tolerate errors and decide what to do with them using the plugin feature as we will see later on the documentation.
Besides this, queuing and the latency functionality are almost the same as in ASTF and can be controlled with the same flags. Pay attention that the pdr-error flag from STL is renamed to allowed-error.
One can use the following command to run with 70 pps latency, allow a maximal latency of 100 usec and latency tolerance of 10%, while allowing 20% queueing capability.
[bash]>./ndr --astf -v -lpps 70 --max-latency 10 --lat-tolerance 10 --q-full 20 --high-mult 60 --low-mult 50
2.4.2. Traffic engineering
Same as in STL, we can use profiles to change the type of traffic we want to run. Just write a ASTF profile (or use an existing one) and load it into the benchmarker. To read more about profiles, please consult the ASTF documentation. The default profile is udp_mix. To control the profiles use the following flags:
-
--profile - The path to the location of the profile.
-
--prof-tun - List of tunables to pass along to the profile just as in a normal profile in ASTF.
For example, to run http_simple with some tunables use:
[bash]>./ndr --astf -v --profile astf/http_simple.py --prof-tun a=1,b=3 --high-mult 1000 --low-mult 500
To run sfr use:
[bash]>./ndr --astf -v --profile astf/sfr.py --high-mult 50 --low-mult 0
2.5. Running Example
Let us see and comment a run. Suppose we ran the following way:
[bash]>./ndr --astf -v --high-mult 75 --low-mult 25 -lpps 50 --max-latency 30 --lat-tolerance 10
We are running the default profile, udp_mix with 50 packets per second latency and allowing tolerance of 10% beyond 30 usec. We guessed the maximal multiplier that won’t cause errors or queue full or invalid latency to be between 25 and 75.
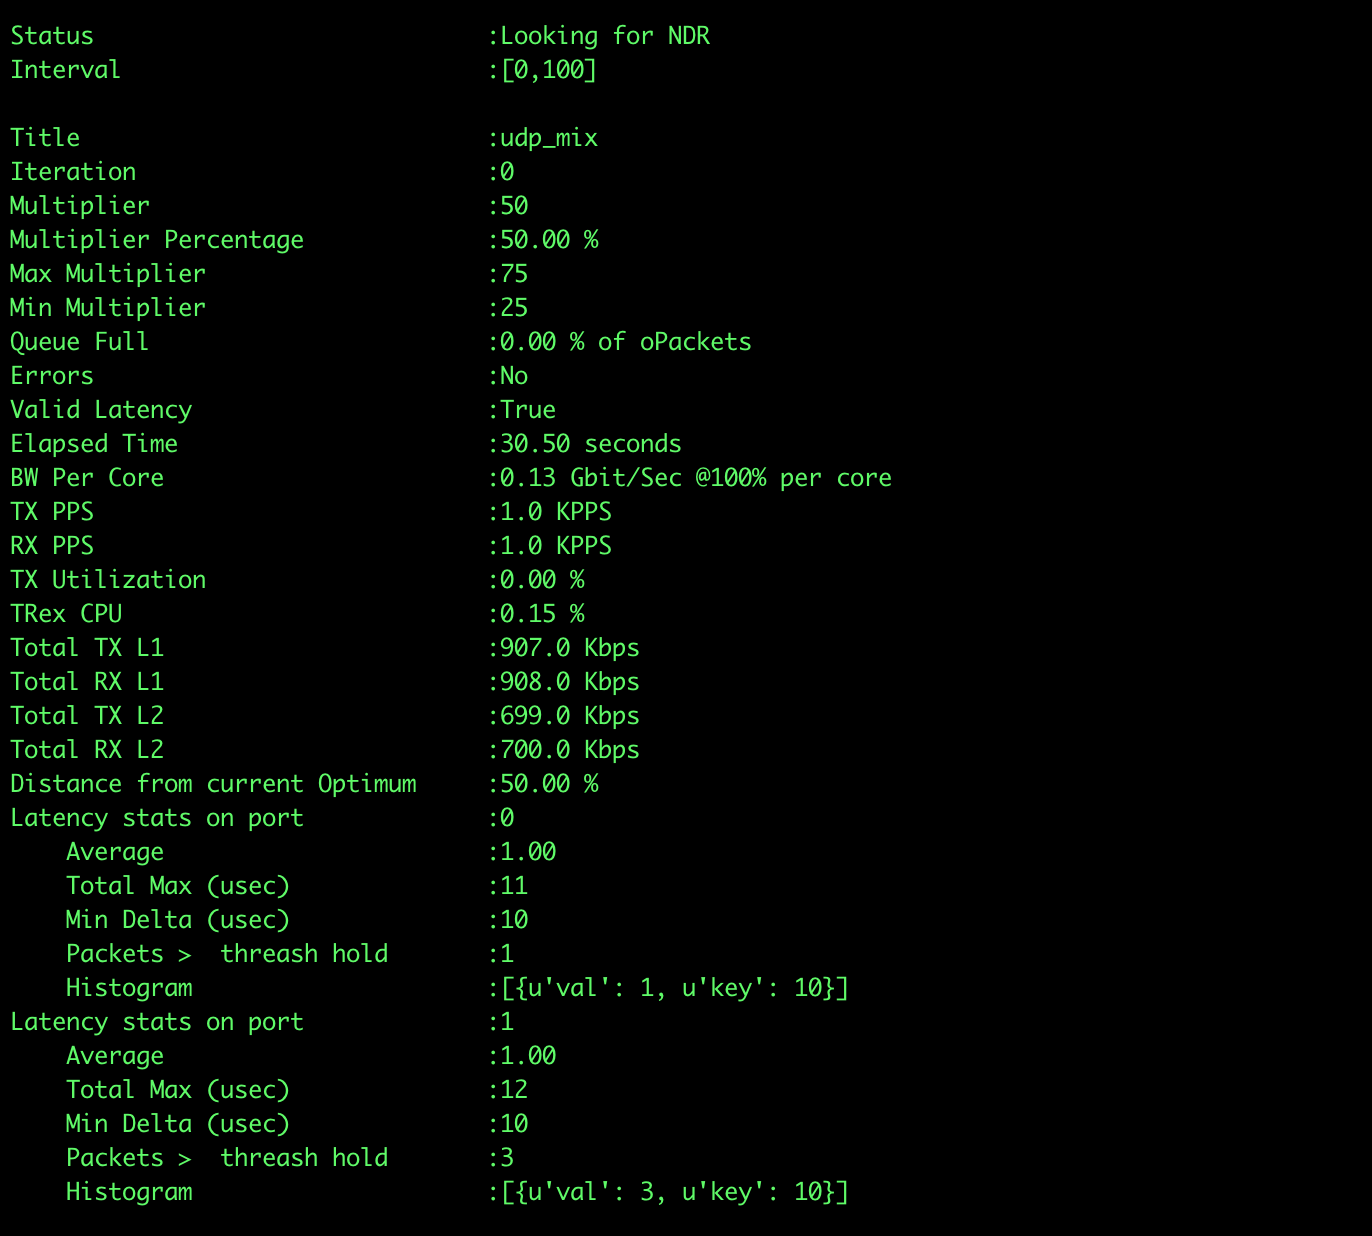
The first transmission would be at 50%, meaning the multiplier being in the middle of the domain between 25 and 75 which happens to be 50. We can see in the following picture that this run is valid, no errors, valid latency and queue full at 0%.
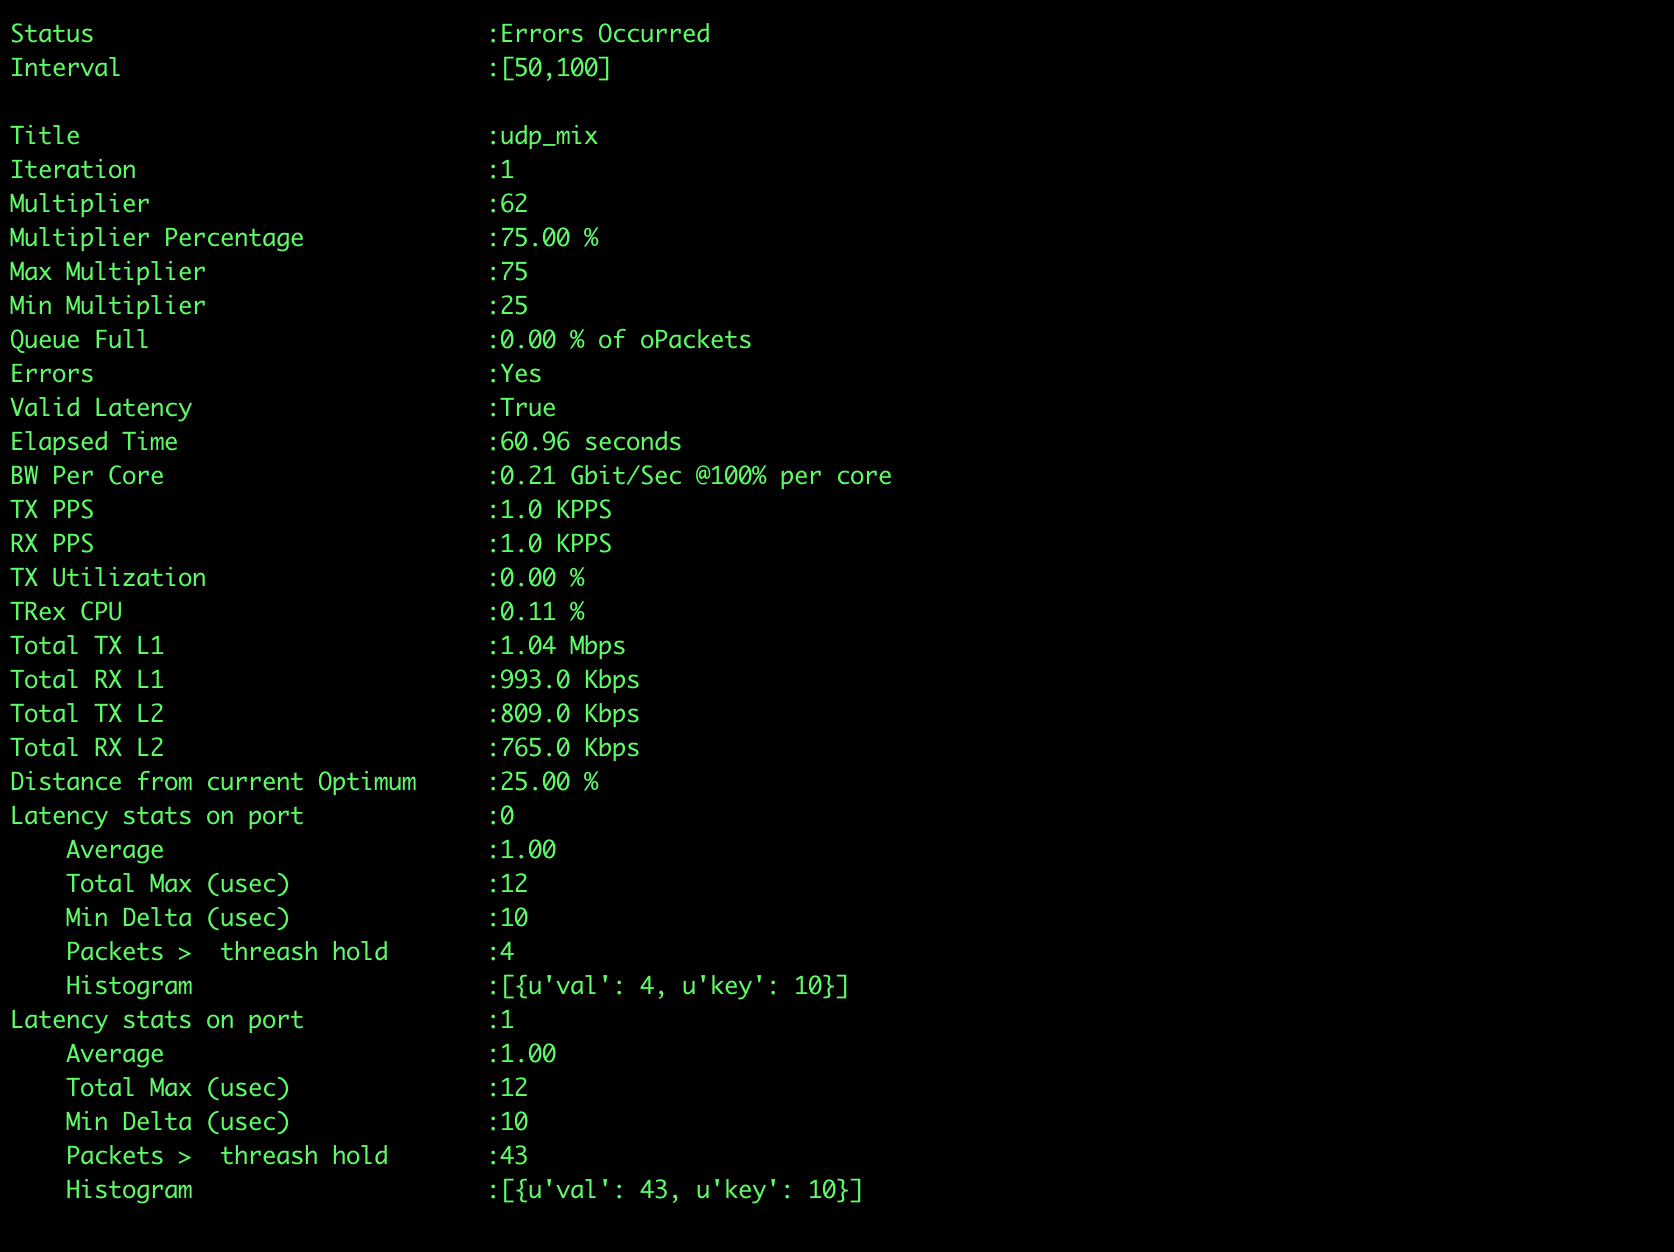
The second transmission would be at 75%, meaning the multiplier would be 62.5 but since it must be an integer it is 62. The following picture shows that transmitting at this rate produces an invalid run since there are errors:
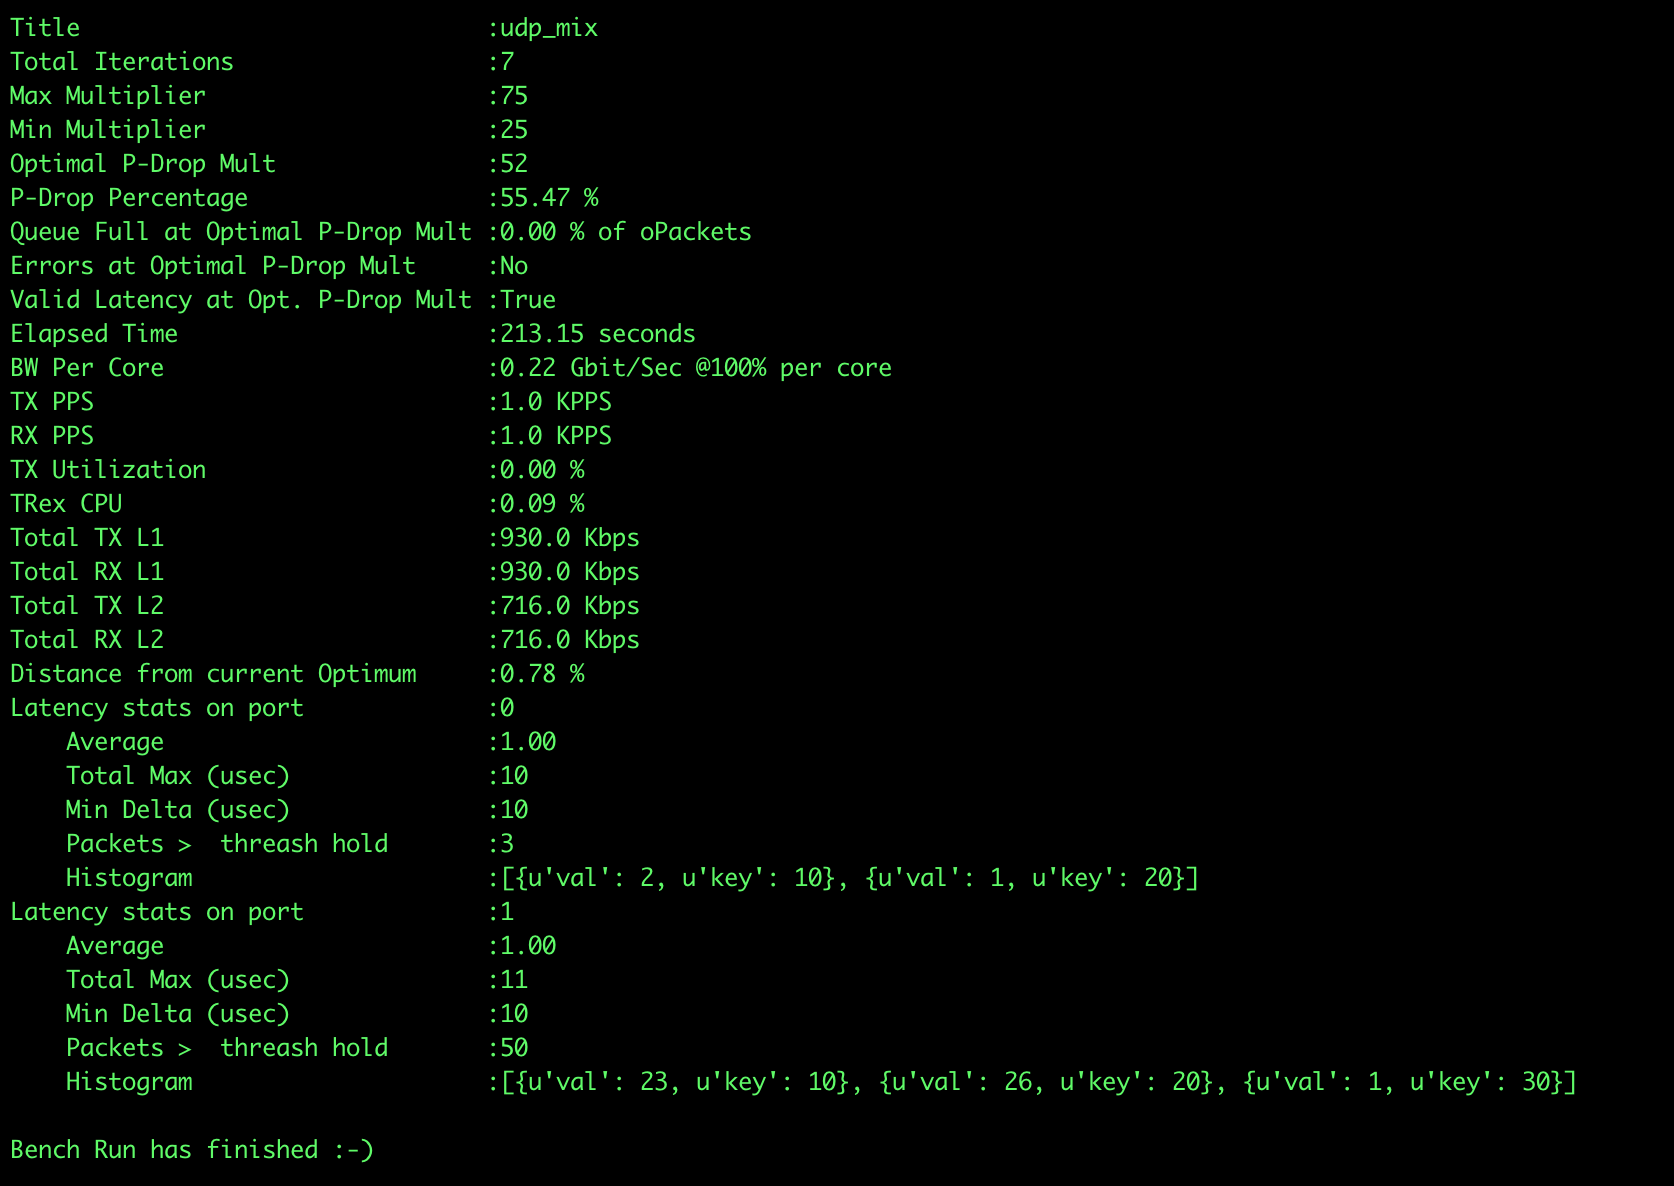
After 7 runs, we can get the following results:
- Discussion
-
The optimal multiplier is found at 55.47% of the domain and the multiplier being 52. At this point, there are no errors and the latency is valid. Wondering why we stopped at 7 iterations? Does this happen usually? The answer lies in the mathematics. The binary search runs in logarithmic complexity. Our allowed error is 1%, and log(100) = 7 where 100 comes from 100%. Say we put the allowed error to be 0.1, in that case, it would take log(100/0.1) = log(1000) = 10 iterations.
2.6. API to the NDR Benchmarker, Plugin files
Same as in STL, in ASTF we can use plugins to decide what to do pre and post transmission. There are two main differences:
-
In ASTF since we don’t transmit at maximum capacity, the API doesn’t receive that parameter.
-
In order to allow the user to tolerate specific ASTF errors, the post iteration must return 2 boolean flags. The first one is the same should stop that we know from STL. The second one invalid errors (True if invalid, False if valid) overrides the error flag and decides for the script if the errors are allowed, hence a valid iteration or not. Note that you must return both flags.
A good use case would be for example to log the errors per multiplier since we can’t see the errors directly in the benchmarker.
import astf_path


class ErrorLogger():
    def __init__(self, name, allowed_errors):
        self.iteration_counter = 0
        self.name = name
        self.client_allowed_errors = set(allowed_errors['client'])
        self.server_allowed_errors = set(allowed_errors['server'])
        self.iteration_to_mult_map = {}
        self.iteration_to_error_map = {}

    def increment_iteration_counter(self):
        self.iteration_counter += 1

    def log(self, errors):
        self.iteration_to_error_map[self.iteration_counter] = errors

    def log_multiplier(self, mult):
        self.iteration_to_mult_map[self.iteration_counter] = mult

    def should_stop(self):
        return self.iteration_counter == 5

    def invalid_errors(self, errors):
        client_errors = set(errors.get('client', []))
        server_errors = set(errors.get('server', []))
        return not (client_errors.issubset(self.client_allowed_errors)  and server_errors.issubset(self.server_allowed_errors))


class ErrorLoggingNDRPlugin():
    def __init__(self, **kwargs):
        allowed_errors = {'client': {u'tcps_conndrops': u'embryonic connections dropped'},
                          'server': {u'err_no_template': u"server can't match L7 template",
                                     u'err_no_syn': u'server first flow packet with no SYN'}
                         }
        self.logger = ErrorLogger(name="Plugin Demonstration for ASTF NDR", allowed_errors=allowed_errors)

    def pre_iteration(self, run_results=None, **kwargs):
        pass

    def post_iteration(self, run_results, **kwargs):
        if run_results['error_flag']:
            self.logger.log(run_results['errors'])
        self.logger.log_multiplier(run_results['mult'])
        self.logger.increment_iteration_counter()
        should_stop = self.logger.should_stop()
        invalid_errors = self.logger.invalid_errors(run_results['errors'])
        return should_stop, invalid_errors


# dynamic load of python module
def register():
    return ErrorLoggingNDRPlugin()


# dynamic load of python module
def register():
    return ErrorLoggingNDRPlugin()
After starting the server, we run the benchmarking in the following way.
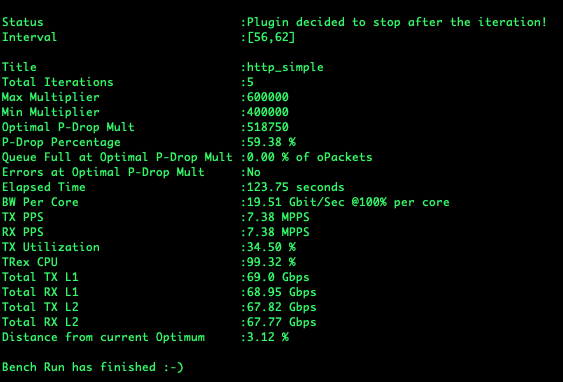
[bash]>./ndr --astf -v --plugin-file automation/trex_control_plane/interactive/trex/examples/astf/astf_error_logging_plugin.py --high-mult 600000 --low-mult 400000 --profile astf/http_simple.py
The plugin not only logs the errors and the multipliers. It decides which errors are tolerated and which not. It also stops the script after 5 runs.